Introduction
Port-Log.net is an online storage and publishing solution for environmental data acquired by different monitoring techniques and sensors. It is commonly used to display tides, wind, waves and other meteorological and oceanographic data types.
Port-log.net provides a variety of ways to view the data, both real-time and historical, from a single site or from a number of sites. This demo showcases a selection of our default displays with live data feed from active Port-Log stations. Displays can be customised to meet your specific needs.
Latest Display (Overview)
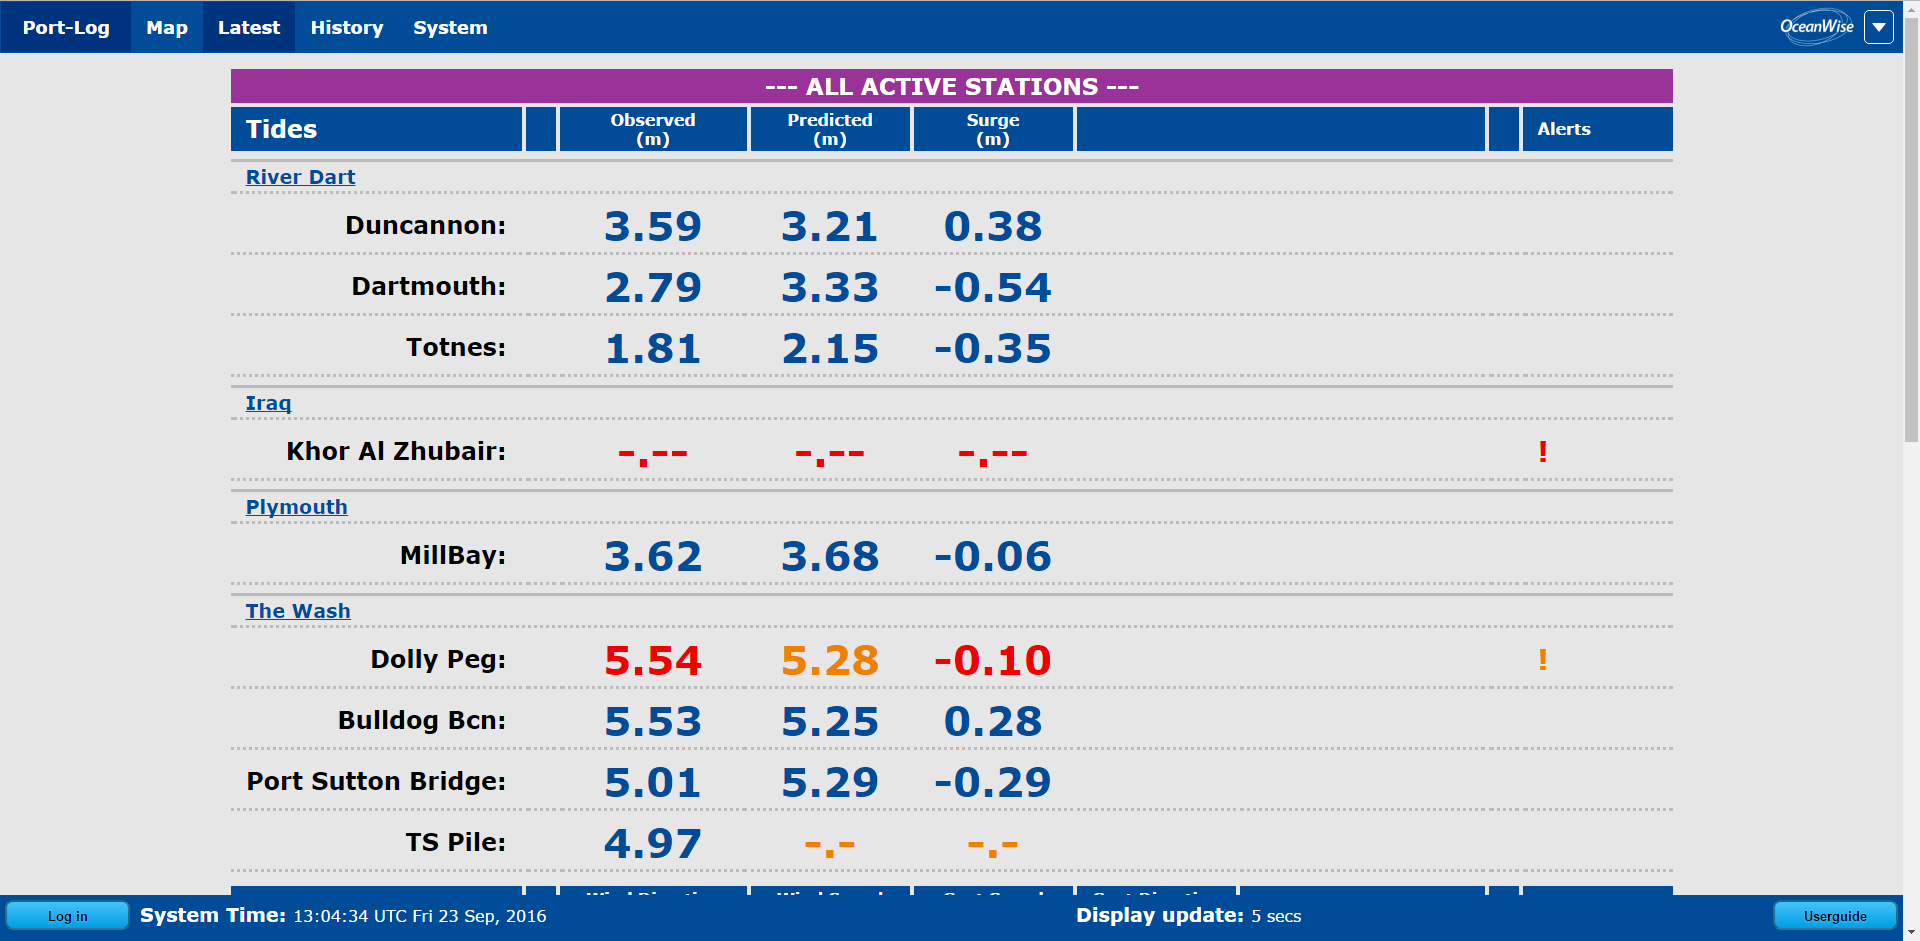
The Latest Display (Overview) provides the latest observations, such as tides, wind, and more, from all available sites. Scroll down to see more data. To access the Latest Display, select 'Latest' from the top menu. To view the latest data for one parameter (e.g. tides) from all sites, select the required parameter from the 'Latest' menu. The colour of the labels shows the status of the data:
- Blue: Valid Data - everything OK
- Amber: Delayed data, or those with a QA/QC warning
- Red: Threshold Warning, eg data above/below a value
- -.--: Dashed Data are those that have timed out, or are not valid
Latest Display (Site)
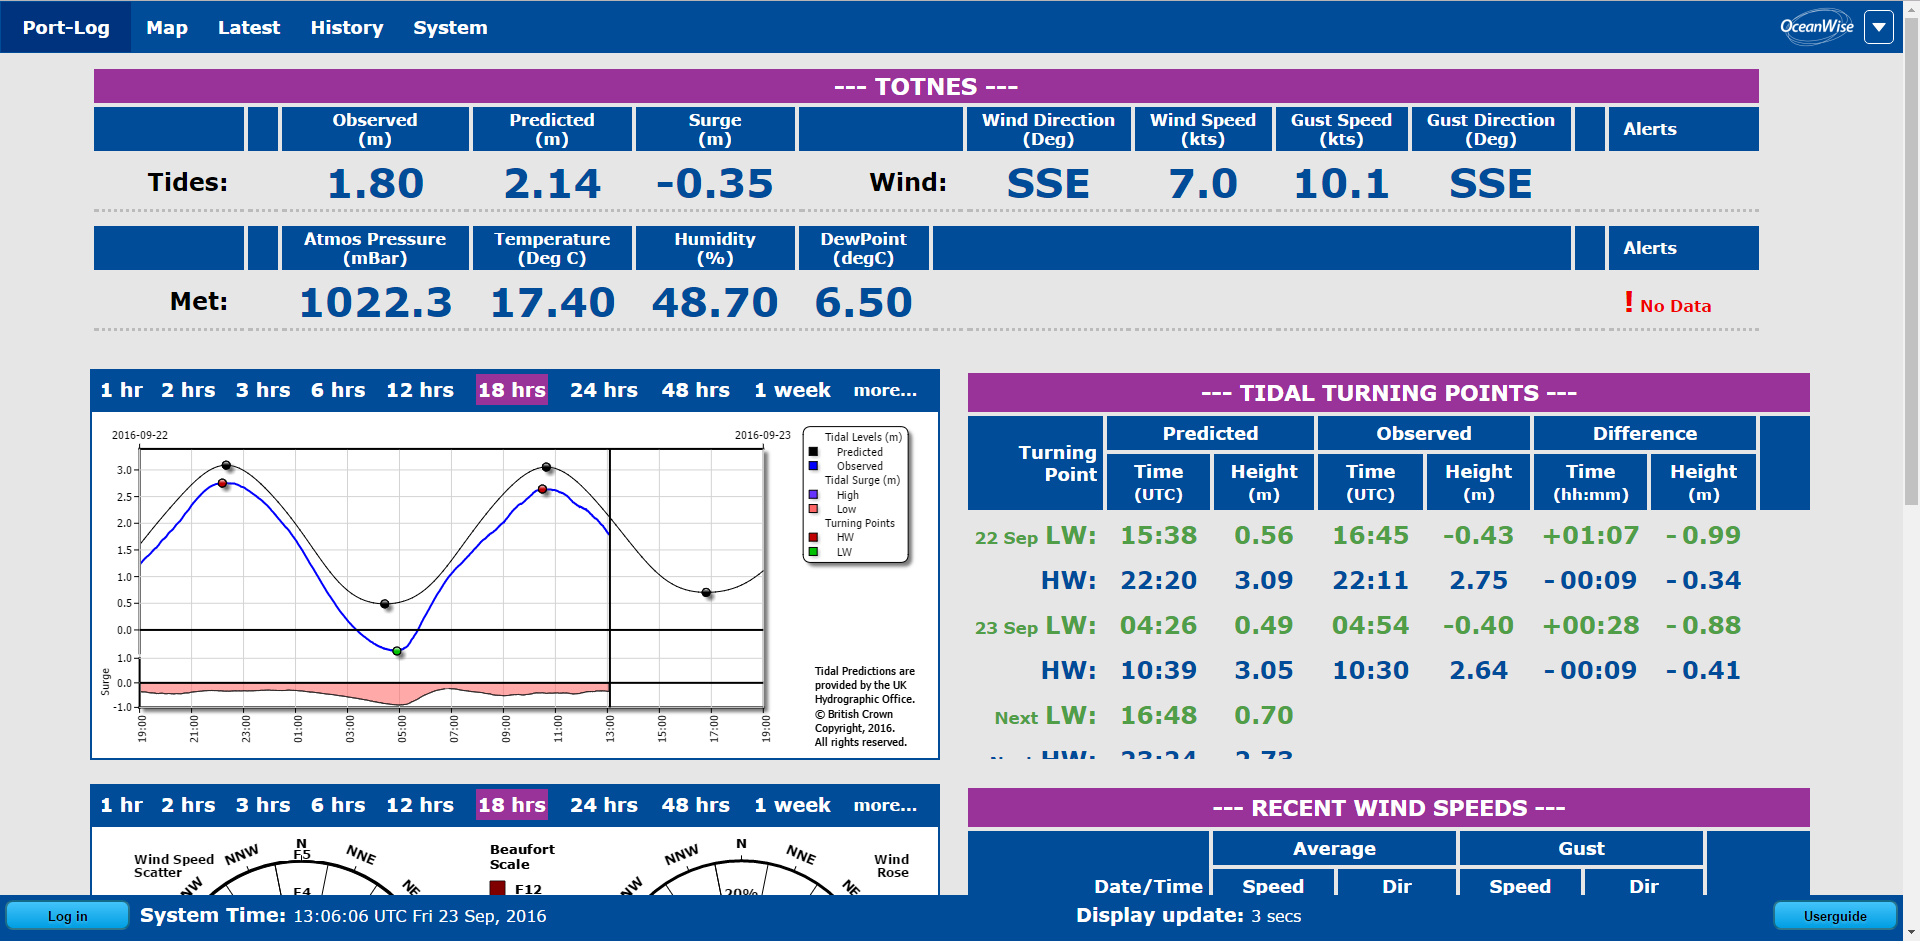
Click on site name to display the latest data from a particular site.
The Latest Display (Site) shows the latest data from a single selected site. Specific parameters, such as wind or waves, can be displayed by selecting the required parameter from the 'Latest' menu. To access Latest Display (Site), click on a site name in the Latest Display (Overview) screen or the site icon on the Map display.
History Display
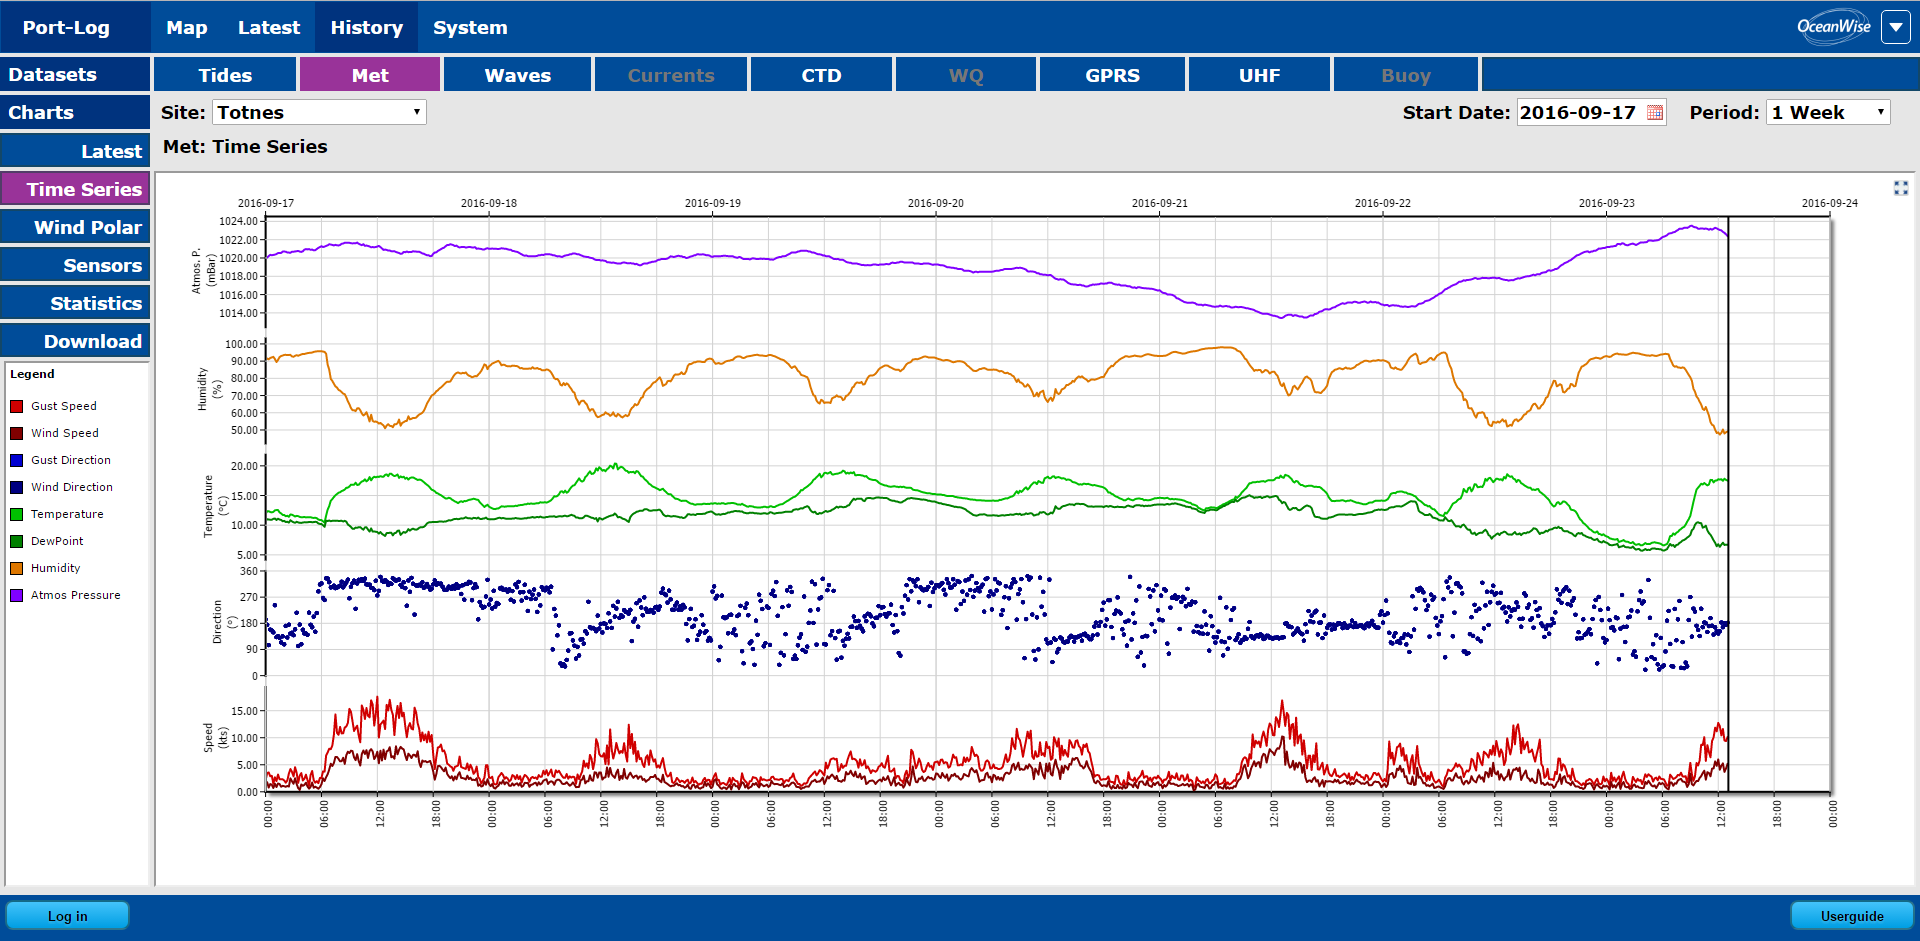
The History Display displays a time-series of historic data from a selected site. To access the History Display, select 'History' from the top menu. Various parameters, such as wind or waves, can be viewed by selecting as required from the History menu. You can view other sites by using the 'Site' dropdown list.
Map Display
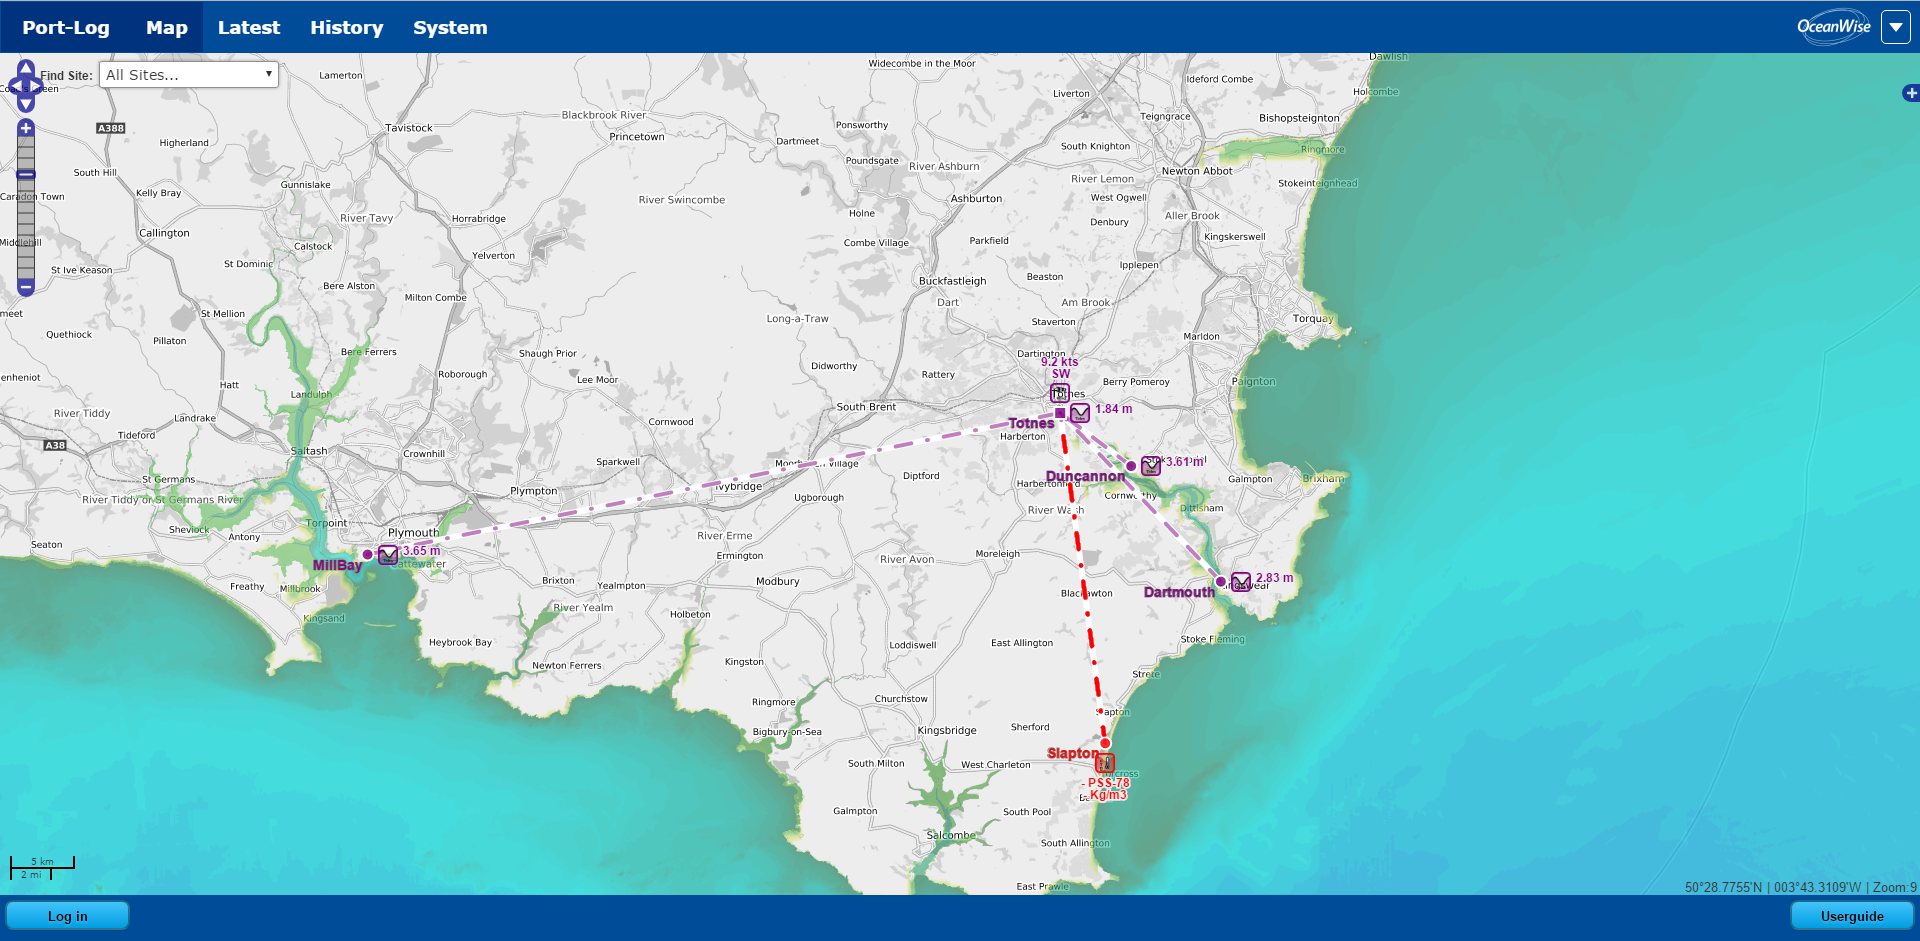
The Map Display is an interactive map showing all of the available data monitoring sites. This demo displays a selection of sites from which data is being stored and published in real-time by Port-Log. To access the Map Display, select 'Map' from the top menu. Use the Zoom and Pan tools, or your mouse, on the left-hand side of the screen to navigate the map. The pullout menu enables you to configure the map layers to your taste. Place your mouse-pointer over a site to display more details.

Console Display
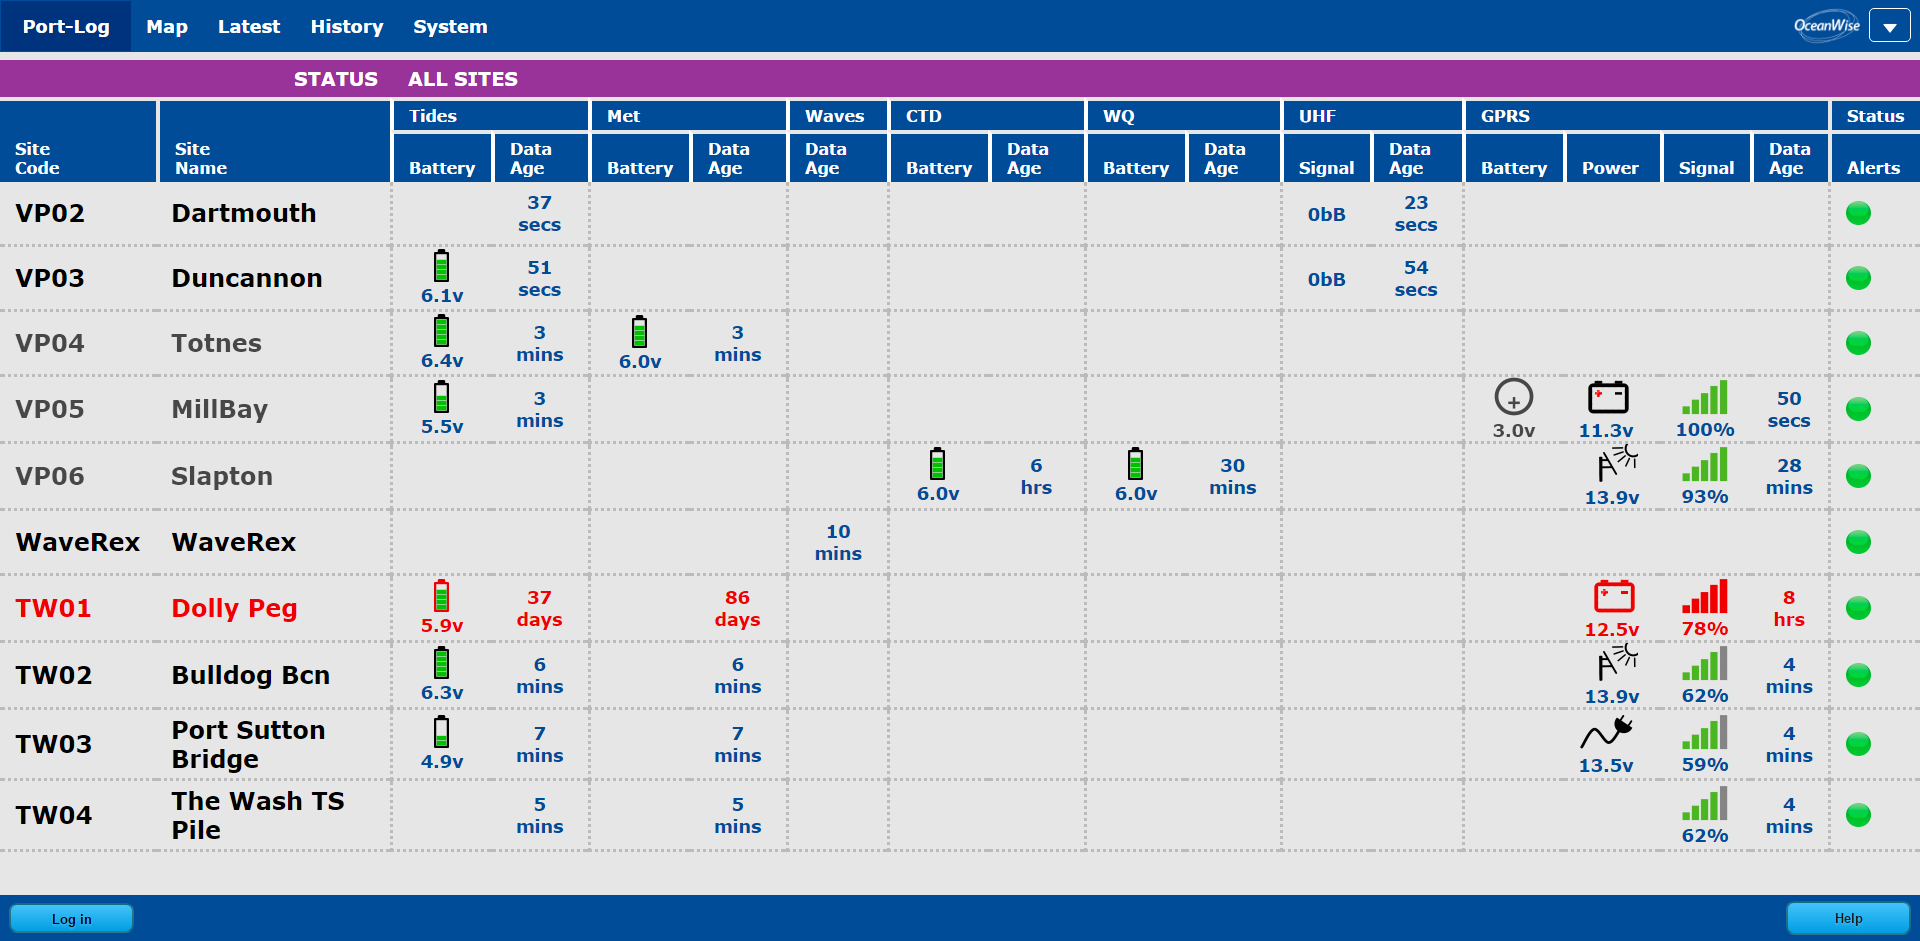
The system incorporates a console page that displays the ages of the data recieved and system information such as battery levels and signal strength. Recent history is available by clicking the symbols, for example, solar power.
This page is essential for engineers to determine transmission faults and diagnostics.
